Heatmap
Atlas primarily supports visualizing data in line charts. As of 1.8, Atlas can also visualize
via heatmaps using the :heatmap line style.
The graph area is broken up into a series of cells and a count for each cell is incremented when
a measurement falls within the cells boundaries. Colors or shades of colors then fill in cells
based on the final count.
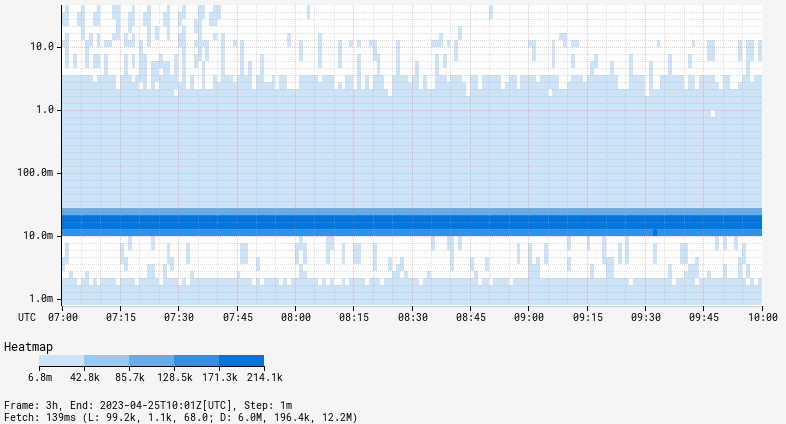
Percentiles
Heatmaps are particularly useful on top of percentile metrics to analyze the entire measurement range.
Note Using the log linear scale will help to highlight clustered regions of measurements
via &scale=log-linear. The example also uses data not available in the demo Atlas instance.
/api/v1/graph?
  e=2012-01-01T00:00
  &no_legend=1
  &q=
    name,requestLatency,:eq,
    :percentile-heatmap,

  &scale=log-linear
Bounds
The &heatmap_l= and &heatmap_u parameters can be used to narrow the range of cells
displayed in a heatmap. Heatmap bounds act on the count of measurements in a cell and the
palette colors or shades chosen. Depending on the bound limits, some cells may appear empty.
| No Heatmap Bounds | With Bounds (&heatmap_l=1.2&heatmap_u=1.3) |
 |  |
name,sps,:eq, (,nf.cluster,),:by, :heatmap | name,sps,:eq, (,nf.cluster,),:by, :heatmap |
Palette
The palette used for filling heatmap cells can be changed via the &heatmap_palette= parameter.
By default, a color is chosen from the global palette (based on whether the heatmap is the
first or a later expression). A gradient is then applied to that color with a lighter gradient
representing smaller cell counts and darker representing larger counts.
| Default Palette | Reds Palette (&heatmap_palette=reds) |
|  |
name,sps,:eq, (,nf.cluster,),:by, :heatmap | name,sps,:eq, (,nf.cluster,),:by, :heatmap |
Custom Palette
A custom palette may be provided by listing the hex colors to use in descending order, meaning the color to use for the highest cell counts must appear first.
/api/v1/graph?
e=2012-01-01T00:00
&q=
name,sps,:eq,
(,nf.cluster,),:by,
:heatmap
&heatmap_palette=(,8cd1b9,46adbc,2a91b8,1978b3,335ca9,413e95,361566,)

For further information, see Custom Color Palettes.
Order of Expressions
When overlaying expressions with a heatmap and using the default palette, the order of expressions determines the color gradient used for cells. For example, if the heatmap expression is second in the query, the second palette color will be used as the gradient:
| Heatmap First | Heatmap Second |
 |  |
name,sps,:eq, (,nf.cluster,),:by, :heatmap, name,sps,:eq, | name,sps,:eq, name,sps,:eq, (,nf.cluster,),:by, :heatmap |
Label
The label for the heatmap can be changed via the &heatmap_label= parameter. By default, the
label is simply heatmap.

name,sps,:eq,
(,nf.cluster,),:by,
:heatmap
Scale
Similar to axis scales, the scale of the heatmap cell colors (or gradients) can be adjusted
using the &heatmap_scale= parameter. By default, the scale is linear though any of the
valid scales may be used.
| Linear | Log Linear |
|  |
name,sps,:eq, (,nf.cluster,),:by, :heatmap | name,sps,:eq, (,nf.cluster,),:by, :heatmap |