Axis Bounds
The upper and lower bounds for an axis can be set to an explicit floating point value or:
auto-style: automatically determine the bounds based on the data and the style settings for that data. In particular, if the line style is area or stack, then the bounds will be adjusted to show the filled area. This is the default behavior.auto-data: automatically determine the bounds based on the data. This will only take into account the values of the lines. In the case of stack it will account for the position of the stacked lines, but not the filled area.
When selecting bounds it is important to think about how it can impact the perception of what is shown. Automatic bounds can be useful for zooming in on the data, but can also lead to mis-perceptions for someone quickly scanning a dashboard. Consider these two graphs showing percent CPU usage on an instance:
| Automatic Bounds | Explicit Bounds |
|---|---|
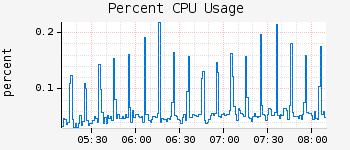 |
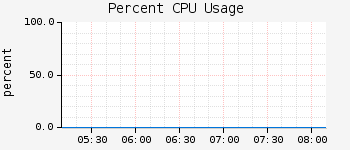 |
The automatic bounds allows us to see much more detail, but could lead a casual observer to think there were frequent large spikes in CPU usage rather than just noise on a machine with very little load.
See Tick Labels for information on Y axis label formatting and suffix information.
Default Lower
/api/v1/graph?
  e=2012-01-01T09:00
  &s=e-1d
  &tz=UTC
  &q=
    name,sps,:eq,
    nf.cluster,(,nccp-xbox,nccp-silverlight,),:in,
    :and,
    :sum,
    (,nf.cluster,),:by

Default Lower Stack
/api/v1/graph?
  e=2012-01-01T09:00
  &s=e-1d
  &tz=UTC
  &q=
    name,sps,:eq,
    nf.cluster,(,nccp-xbox,nccp-silverlight,),:in,
    :and,
    :sum,
    (,nf.cluster,),:by,
    :stack

Default Upper
/api/v1/graph?
  e=2012-01-01T09:00
  &s=e-1d
  &tz=UTC
  &q=
    name,sps,:eq,
    nf.cluster,(,nccp-xbox,nccp-silverlight,),:in,
    :and,
    :sum,
    (,nf.cluster,),:by,
    :neg

Default Upper Stack
/api/v1/graph?
  e=2012-01-01T09:00
  &s=e-1d
  &tz=UTC
  &q=
    name,sps,:eq,
    nf.cluster,(,nccp-xbox,nccp-silverlight,),:in,
    :and,
    :sum,
    (,nf.cluster,),:by,
    :neg,
    :stack

Explicit Bounds
Note the &l=0 and &u=60e3 parameters.
/api/v1/graph?
  e=2012-01-01T09:00
  &s=e-1d
  &tz=UTC
  &l=0
  &u=60e3
  &q=
    name,sps,:eq,
    nf.cluster,(,nccp-xbox,nccp-silverlight,),:in,
    :and,
    :sum,
    (,nf.cluster,),:by

Note
It is possible to define the boundaries beyond the range of the data source so that a graph appears empty.
Auto Lower
/api/v1/graph?
  e=2012-01-01T09:00
  &s=e-1d
  &tz=UTC
  &l=auto-data
  &
  &q=
    name,sps,:eq,
    nf.cluster,(,nccp-xbox,nccp-silverlight,),:in,
    :and,
    :sum,
    (,nf.cluster,),:by,
    :stack

Auto Upper
/api/v1/graph?
  e=2012-01-01T09:00
  &s=e-1d
  &tz=UTC
  &u=auto-data
  &
  &q=
    name,sps,:eq,
    nf.cluster,(,nccp-xbox,nccp-silverlight,),:in,
    :and,
    :sum,
    (,nf.cluster,),:by,
    :stack